Apache Spark with Docker - very quick start
Would you like to quickly start testing some code using Spark? Perhaps this post can help you to achieve this task with the smallest effort to install all the necessary requirements for a single machine. The most time spending requirement here (that doesn’t really take much time or effort) is to install Docker (installation docs).
If you don’t know what Docker is, you could imagine it as an engine that allows you to create and run very light virtual machines. With Docker installed and running, we can easily run a “virtual machine” (a container, an instance of a Docker image) with Apache Spark installed and configured.
One Docker image I strongly suggest is jupyter/all-spark-notebook. This image includes a Jupyter Notebook with support to multiple languages, like Python, Scala and R. In the case of Python, for example, it also includes some popular libraries for data science, like Scikit-learn and Pandas.
Running a container
Let’s run a container of the image above with the following command in a terminal (depending on your installation, super user permissions might be required):
docker run -d --name spark-notebook \
    -p 8888:8888 -v $PWD:/home/jovyan/work/data \
    jupyter/all-spark-notebook
This command launches a container with a Jupyter notebook accessible by the port
8888 and mounts the current directory (note $PWD) onto /home/jovyan/work/data
inside the container. All files inside the current directory will be available for
your notebooks. Access localhost:8888 with your browser to check if Jupyter is
running as expected.
A simple example
Let’s create a simple example using the Python 2.7 kernel for our notebook. First we import all necessary libraries, declare a Spark context (this basically launches a JVM with the specified configurations) and some plot configurations to be used later.
import pandas as pd
import datetime as dt
import matplotlib.pyplot as plt
from pyspark import SparkContext, SQLContext

## Lauching Spark's JVM.
sc = SparkContext("local[*]")

## Plot style configurations.
%matplotlib inline
plt.style.use('ggplot')

## A resonable size of plots
fsize = (12,8)
The next codes assume we have a file students_scores_samples.txt inside the data
directory. Each line of this file represents a record of a student exam and is
composed of a date, an ID and a score. The first two lines of the file look like
this:
2014-01-20,A2,4.0
2014-01-15,A1,1.5
To manipulate better this data after reading the file, we could parse each line and create objects with the expected type for each field.
data = (sc.textFile('data/students_scores_samples.txt')
        ## Breaking lines into fields.
        .map(lambda line: line.split(','))
        ## Creating objects of different types.
        .map((lambda (date, student_id, score):
             (dt.datetime.strptime(date, '%Y-%m-%d'),
             student_id,
             float(score))))
        )
Now we have a “potential” list of tuples composed of a datetime.datetime, a string
and a float number. By “potential” I mean that we didn’t really processed the file
yet, we just created a kind of “recipe” (or a sequence of transformations) to be
executed by Spark when an action is taken. Try to call the action collect()
from the our object data, for instance.
To make things a bit more visual, let’s plot our parsed data as a scatter plot.
## Only dates.
x = data.map(lambda rec: rec[0]).collect()
## Only scores.
y = data.map(lambda rec: rec[2]).collect()
## List of 0s and 1s. 0 if student_id is 'A1'; 1 otherwise.
colors = data.map(lambda rec: 0 if rec[1] == 'A1' else 1).collect()

plt.figure(figsize=fsize)
plt.scatter(x=x, y=y, s=50, c=colors, cmap='brg')
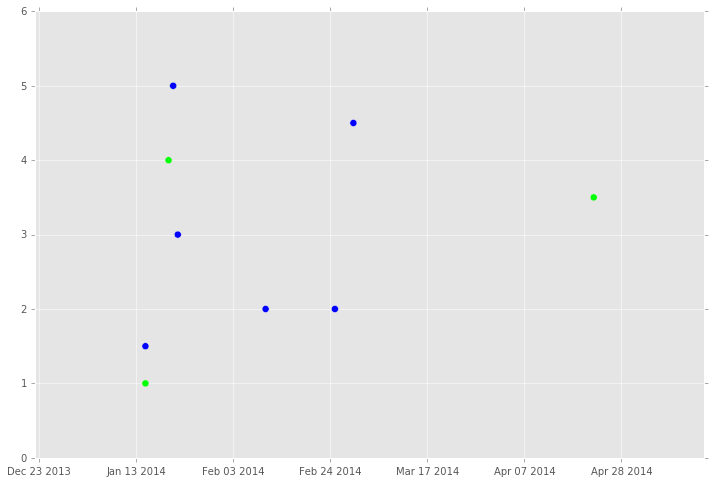
Note that we called now the action collect() to be able to work with Matplotlib
with normal Python lists. This action is executed three times, causing our previous
transformations and file reading to be also executed three times. A good and simple
optimization could be achieved using cache() at the end of our common
transformations.
SQL and DataFrames
Spark SQL and DataFrames is a very interesting submodule to manipulate data as tables, including an API to execute queries using SQL.
From our previous example, we could create a DataFrame by giving data (a RDD) and a
list of column names:
sqlsc = SQLContext(sc)

dataframe = sqlsc.createDataFrame(data, ['date', 'student_id', 'score'])
dataframe.show()

#  +--------------------+----------+-----+
#  |                date|student_id|score|
#  +--------------------+----------+-----+
#  |2014-01-20 00:00:...|        A2|  4.0|
#  |2014-01-15 00:00:...|        A1|  1.5|
#  |2014-01-21 00:00:...|        A2|  5.0|
#  |2014-01-21 00:00:...|        A1|  5.0|
#  |2014-01-22 00:00:...|        A1|  3.0|
#  |2014-02-10 00:00:...|        A1|  2.0|
#  |2014-01-15 00:00:...|        A2|  1.0|
#  |2014-04-22 00:00:...|        A2|  3.5|
#  |2014-03-01 00:00:...|        A1|  4.5|
#  |2014-02-25 00:00:...|        A1|  2.0|
#  +--------------------+----------+-----+
If you know Pandas, you can see something familiar on the method describe():
dataframe.describe().show()

#  +-------+------------------+
#  |summary|             score|
#  +-------+------------------+
#  |  count|                10|
#  |   mean|              3.15|
#  | stddev|1.4729034063523803|
#  |    min|               1.0|
#  |    max|               5.0|
#  +-------+------------------+
With DataFrames, we can easily calculate the average score per student almost like in SQL:
import pyspark.sql.functions as sqlfn

(dataframe.groupBy('student_id')
 .agg(sqlfn.avg('score').alias('avg_score'),
      sqlfn.count('*').alias('num_exams'))
 .show()
)

#  +----------+---------+---------+
#  |student_id|avg_score|num_exams|
#  +----------+---------+---------+
#  |        A1|      3.0|        6|
#  |        A2|    3.375|        4|
#  +----------+---------+---------+
It’s important to mention that DataFrame’s API is richer than it looks like and the code above could be written in many different ways. Its documentation is usually well enough described to help us explore the different possibilities.
Conclusion
This post described one simple (if not the simplest) way to get started with Apache Spark by using Docker to simplify its installation. Of course that, although the given example can help to understand the basics of Spark, we would need much more data to really perceive any of Spark’s performance features for that code.
Finally, if you are a Vim user and want to run Spark connected to a database, consider checking the Dockerfile of boechat107/ext-spark-notebook.